


Most landlords measure vacancy one way: days on market. But that single metric hides a costly blind spot. Based on 372 leases managed across the Chicago metro area in 2025, there are actually two distinct vacancy periods that eat into your returns, and the second one rarely shows up in any report.
The Vacancy Metric You're Probably Missing
Here's how most investors think about vacancy: the unit goes empty, you list it, someone signs a lease, vacancy ends. Done.
Here's how vacancy actually works: the unit goes empty, you list it, someone signs a lease, and then you wait an average of 10.8 more days before that tenant moves in and rent starts flowing.
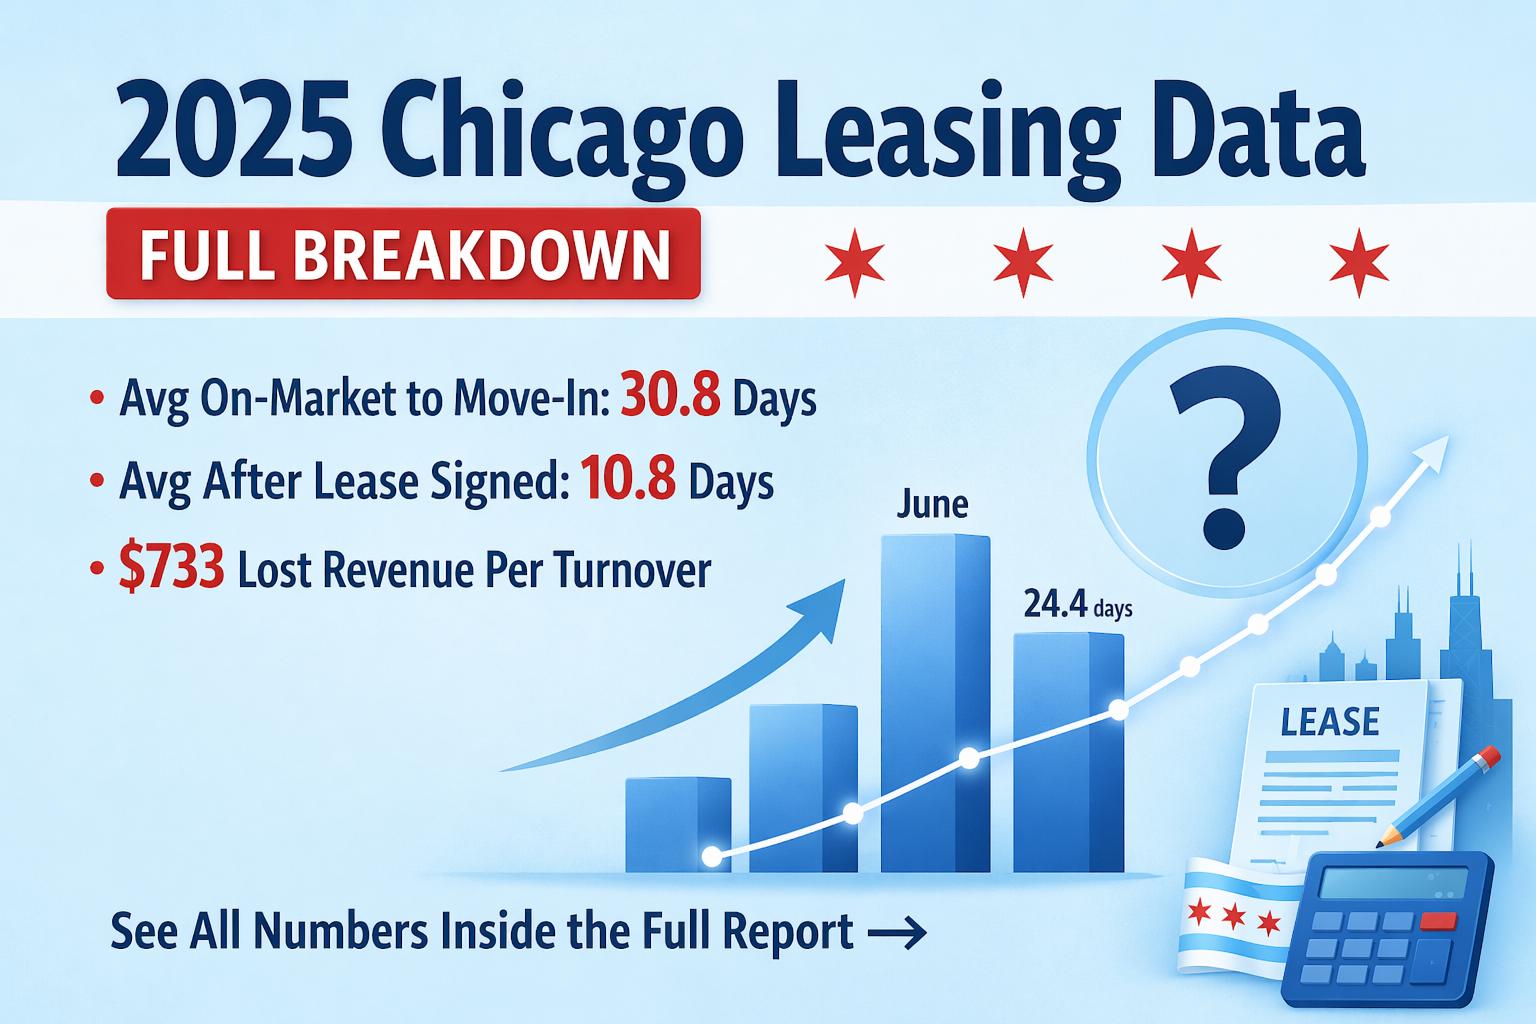
That gap between lease signing and move-in is real vacancy. The mortgage doesn't pause. Utilities keep running. And on a $2,000/month unit, those 11 days represent approximately $733 in income that simply never arrives.
The two numbers that actually define your vacancy performance:
Days from vacancy to move-in: 30.8 days (2025 portfolio average)
Days from signed lease to move-in: 10.8 days (the hidden gap)
The first number gets reported. The second almost never does.
How Vacancy Shifts Month by Month
Seasonal timing has a dramatic effect on how long units sit. The gap between the best and worst months in 2025 was 18 days, a difference worth over $1,200 in lost rent on an average Chicago unit.
The table below tracks both vacancy metrics across all 12 months. Note the third column carefully: post-signing gaps don't follow the same seasonal pattern as total vacancy time.
Month | Days: On-Market to Move-In | Days: Signed Lease to Move-In |
January | 39.0 | 12.3 |
February | 38.0 | 11.1 |
March | 35.0 | 10.5 |
April | 30.4 | 9.8 |
May | 32.1 | 10.2 |
June | 24.4 | 11.0 |
July | 24.9 | 14.1 |
August | 26.5 | 12.4 |
September | 33.7 | 7.9 |
October | 28.2 | 9.6 |
November | 36.5 | 11.3 |
December | 42.5 | 13.1 |
A few patterns worth highlighting:
June delivered the fastest overall turnovers at 24.4 days, families moving before school starts, new graduates relocating after spring, and longer days making showings easier.
December was the slowest at 42.5 days. If you can avoid lease expirations in winter, do it.
July had the longest post-signing gap (14.1 days) despite being peak season. The reason: tenants signing in July are often securing an August 1st or mid-August move-in to align with the school calendar. They signed early, but they're not ready to move yet.
September had the shortest post-signing gap (7.9 days). Late-summer tenants who haven't found housing yet move quickly once approved, urgency compresses the timeline.
Move-In Volume: Where the Demand Actually Concentrates
The seasonal story is reinforced by move-in volume. Looking at actual move-ins by month across the 2025 portfolio:
Slowest month: January, just 10 move-ins
Peak month: August, 53 move-ins
January and February combined: 24 move-ins
June through August combined: 130 move-ins
August alone represented 14% of the entire year's move-ins. The implication for landlords: if your units aren't positioned to capture summer demand, you're competing in the hardest months instead of the easiest ones.
Where Does Your Portfolio Stand? Chicago Benchmarks
Use the figures below to assess how your own turnovers compare to the Chicago market. Both metrics matter, total vacancy time and the post-signing gap are separate operational problems with separate solutions.
Performance Tier | Vacancy to Move-In | Post-Signing Gap |
Top Quartile | Under 20 days | Under 7 days |
Median | 24 days | ~10 days |
Average (2025) | 30.8 days | 10.8 days |
Red Flag | Over 45 days | Over 14 days |
If your total vacancy exceeds 31 days, you're below market average. If your post-signing gap runs past 14 days, that's a process issue worth examining: are you requiring excessive lead time before possession? Is your maintenance crew delaying unit readiness? These inefficiencies scale badly across a portfolio.
Four Ways to Tighten Your Vacancy Timeline
Based on this dataset and operational experience across 1,400+ Chicago units, these are the highest-leverage adjustments landlords can make:
1. Pre-lease before the unit is vacant
Start marketing 45-60 days before the current lease ends. The best-performing turnovers had signed leases before the outgoing tenant moved out. This is especially effective on the north and northwest sides of Chicago, where renters tend to search earlier and are comfortable viewing occupied units.
2. Compress your turnover window
Target 5-7 days for standard unit turns. Have maintenance and vendors scheduled before move-out day, not after. Waiting until the unit is empty to start scheduling adds days of pure dead time.
3. Stop defaulting to first-of-month move-ins
If a unit is rent-ready on the 15th, offer a prorated move-in rather than letting it sit until the 1st. That's two weeks of rent you'd otherwise lose for no reason.
4. Engineer your lease expirations
Structure leases to expire in May through August whenever possible. If you inherit a December expiration, consider offering a short-term renewal to shift it into a stronger leasing window. The math on a slightly discounted renewal often beats the cost of a winter vacancy.
The Bottom Line for Chicago Investors
The average vacancy in 2025 across this Chicago portfolio was 30.8 days. Of that, 10.8 days, more than a third, occurred after the lease was already signed.
Most landlords aren't tracking that second number. They're reporting clean lease-up times while quietly absorbing 11 days of hidden vacancy every turnover.
The difference between a 25-day turnover and a 43-day turnover is roughly $1,200 per unit in lost rent. Across a 10-unit portfolio turning over half the units each year, that's $6,000 annually, and it compounds as your portfolio grows.
Track both numbers. Require your property manager to report both numbers. And if you're structuring new leases, let the seasonal data guide your expiration timing. The calendar has patterns, use them.